广州雅思培训小编要分享的是雅思写作备考类: 雅思写作数据图作文范文2
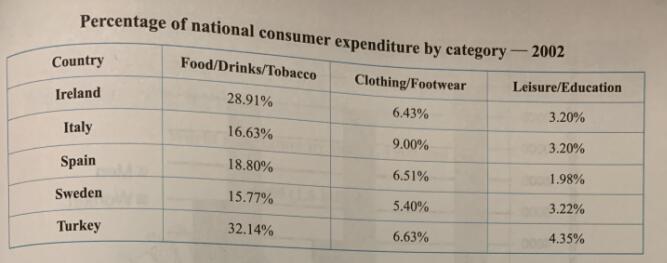
The table below gives information on consumers'spending on different items in five different countries in 2002.
Summarise the information by selecting and reporting the main features,and make comparisons where relevant.

The table shows the spending patterns(in percentage)of three categories of products or services in
five countries in 2002.[介绍图表信息]
Among the five countries,the consumer spending on food,drinks and tobacco was much higher in
Turkey(32.14%)最大值]and Ireland(28.91%),while that in the other three countries was more or
less half the proportion,ranging from 15.77%[最小值]to 18.80%.
Clothing and footwear,as a category of the second largest consumers'expenditure,had a much lower
proportion than food,drinks and tobacco.However,of the five countries the highest was in Italy,as
much as 9.00%,最大值]and the lowest in Sweden,as little as 5.40%.(最小值)
Finally,although the percentage of expenditure on leisure and education is the lowest with Spain at
only 1.98%,[最小值]Turkey still ranked high at4.35%.[最大值]
Overall,the largest proportion of spending lay in food,drinks and tobacco,while the smallest on
leisure and education.[总结段,总结图表主要特点]
上一篇: 雅思写作流程图基本写作结构常用表达
下一篇: 雅思写作数据图作文范文1

