广州雅思培训小编要分享的是雅思写作备考类:雅思写作数据图作文范文1
例题1:
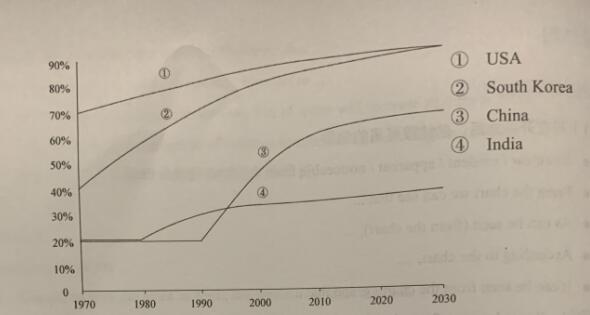
The graph below shows the percentage of population growth in four countries since 1970swith projection to 2030.
Summarise the information by selecting and reporting the main features,and makecomparisons where relevant.

The line graph describes the growth rate of population in the USA,South Korea,China and India from1970to2030.[介绍图表信息]
It is clearly seen that the population of the USA,South Korea and China have a significant increase during the whole period,while in India the increase is much slower.[总结段,总结图表主要特点]
In 1970,the USA had the largest proportion(about 70%)among the four countries.最大值]The following 50 years saw a steady increase,with the proportion rising to about 88%.During the sameperiod,South Korea followed a similar trend,approximately from 40%to,[趋势相似]getting closer to the USA.
In contrast,the figure of China and India was the lowest最小值]and remained stable at[趋势稳定] around 20%for the first decade.After that,the percentage of India went up slowly and reached about 35%in 2010,while China kept the unchanged situation[趋势稳定]for another ten years and
then the percentage soared,exceeding India in 1995[转折点]and reaching nearly 61%in 2010.
It is predicted that[预测,将米时]during the next two decades the percentages of the USA and South Korea will continue to increase and reach at the same figure of around 90%and that of China will grow to about 66%,but India is supposed to remain at about 35%.
上一篇: 雅思写作数据图作文范文2
下一篇: 雅思写作数据图作文总结段怎么写?

